Electricity Consumption Forecasting — End-to-End ML Pipeline
- 1. Suggest hypotheses about the causes of observed phenomena
- 2. Assess assumptions on which statistical inference will be based
- 3. Support the selection of appropriate statistical tools and techniques
- 4. Provide a basis for further data collection through surveys or experiments
1. Suggest hypotheses about the causes of observed phenomena
This project is structured around four independent layers that communicate through a central PostgreSQL database.
The data ingestion layer runs as a daily cron job on a local machine. It authenticates against the RTE API, fetches the last 24 hours of realized electricity consumption for mainland France, cleans the raw 15-minute data into hourly averages, and inserts it into Supabase with conflict handling to avoid duplicates.
The modeling layer runs on Google Colab (GPU). A Chronos-2 foundation model is fine-tuned via LoRA on the full historical dataset and generates 48-hour probabilistic forecasts, which are stored back into Supabase alongside confidence intervals.
The serving layer is a Streamlit application that reads directly from Supabase and displays historical consumption, forecasts, and prediction intervals in an interactive dashboard.
The storage layer is a PostgreSQL database hosted on Supabase, acting as the single source of truth for both historical data and predictions.
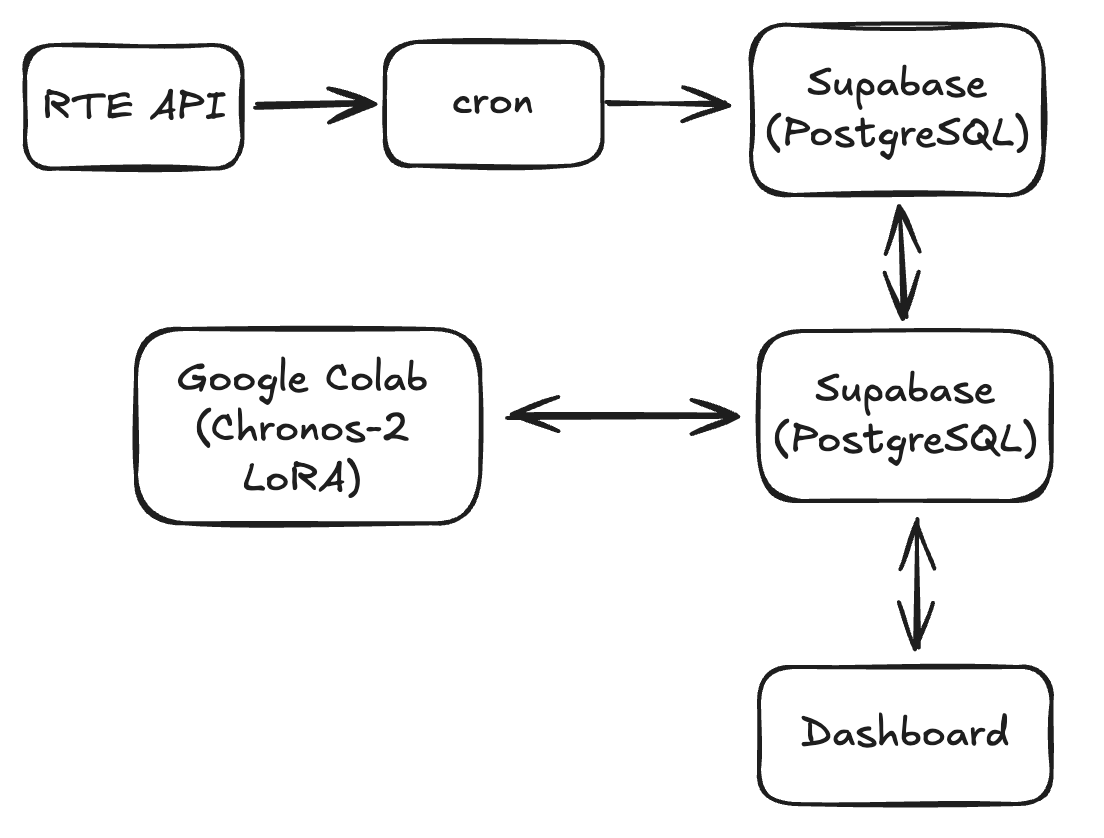
Description of the architecture
if (isAwesome){
  return true
}
On remarque que le modèle suit la loi normale : $X \sim \mathcal{N}(\mu, \sigma^2)$
2. Assess assumptions on which statistical inference will be based
if (isAwesome){
  return true
}
3. Support the selection of appropriate statistical tools and techniques
Ceci est la description de mon image en italique et centrée
4. Provide a basis for further data collection through surveys or experiments
Sed ut perspiciatis unde omnis iste natus error sit voluptatem accusantium doloremque laudantium, totam rem aperiam, eaque ipsa quae ab illo inventore veritatis et quasi architecto beatae vitae dicta sunt explicabo.
For more details see GitHub Flavored Markdown.